THE ISSUE:
ProbPlot analysis of exploration geochemical data is a highly effective means of identifying samples with common geochemical signatures and classifying them into related groups. ProbPlot software was widely used for this analysis and became an industry standard for serious geochemical reports in the 1980’s and early 1990’s. The ProbPlot software was originally developed for the DOS operating system but was not upgraded to the Windows operating system. As valuable as ProbPlot software was, its use eroded over time, solely due to the discontinuation of DOS software and hardware. As such, ProbPlot geochemical data analysis is no longer commonly used by mineral explorationists.
THE SOLUTION:
Drs. Clifford Stanley and James Diamond of Acadia University have undertaken to redesign/upgrade the ProbPlot software to give it more functionality and make it more accessible. It is being developed in Java so that it is accessible on virtually all laptops, desktops or workstations, including those running MS-windows, Apple OS X, Linux or Unix. As well as having all of the functionality of the original program, it will incorporate many new features (e.g., interactive graphics, consequence-based interpretation) that will significantly increase understanding of cumulative frequency data, the element concentrations used in mineral explorations and its value to mineral exploration and the mining industry in overall.
INNOVATION IN PROGRESS:
The development and testing of the software is in progress through the summer and fall of 2013. Beginning in January 2014, this CEMI-funded project will be available for download to all geoscientists and to the global mining industry on the CEMI website in the short term until the means of web distribution are finalized.

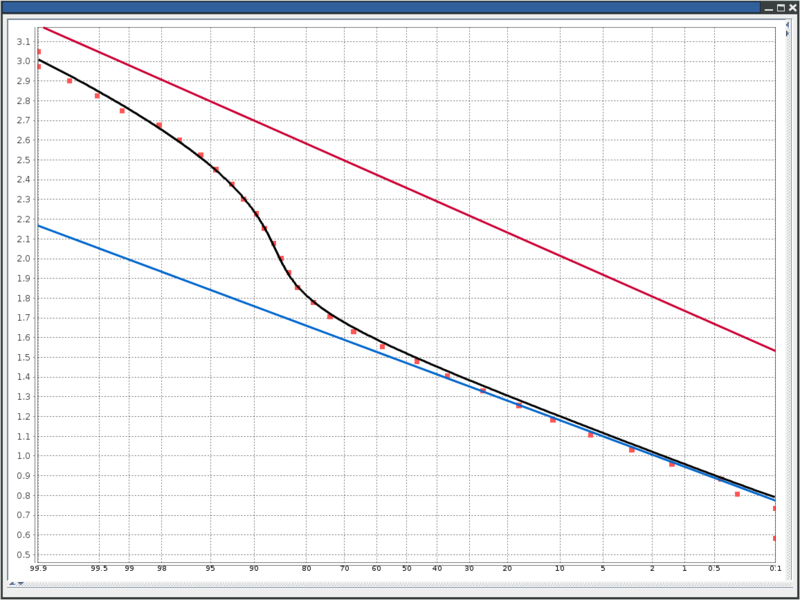
Figures 1 and 2 present a probability plot and its corresponding histogram of an element concentration generated by the SOPP software. The program has been used to optimally fit the underlying frequency data with two normal sub-populations (straight lines on the probability plot, blue and red bell curves on the histogram). The resulting frequency model (curved black lines on both plots) can be used to determine the most appropriate thresholds to classify the samples into two categories (e.g., ‘anomalous’ and ‘background’, ‘sandstone’ and ‘shale’, ‘ore’ and ‘waste’, etc.) and thus facilitate accurate geochemical data interpretation.
Contact
- Cliff Stanley, Acadia University
- 1-905-585-1344
- cliff.stanley@acadiau.ca
- www.acadiau.ca

Solution team
- Douglas Morrison, CEMI
- James Diamond, Acadia University
- Bruce Downing, New Carolin Gold Corp
- Alastair Sinclair, University of British Columbia (Professor Emeritus)